UAV Crop Monitoring for UK Spring Cereals
Multispectral UAV crop monitoring is increasingly used across the UK to assess early-stage cereal performance and identify variability before it becomes visible.
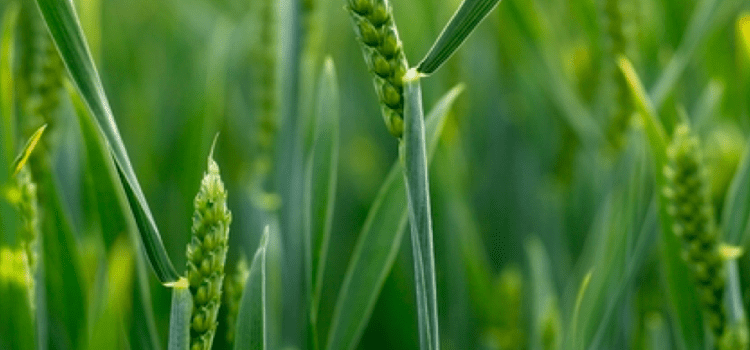
Spring is a critical period in the UK arable calendar. Fields that remain largely dormant through winter rapidly transition into active production as spring cereals are drilled and early growth begins.
For crops such as spring barley and spring wheat, with growing cycles typically ranging from 90 to 130 days, the margin for error is limited. Early-stage variability can directly influence final yield, with limited opportunity for later correction.
At this stage, timely and accurate crop assessment is essential. Traditional field inspection provides only a partial view of conditions across a site. In contrast, multispectral drone surveys enable rapid, field-scale assessment of crop performance, identifying variability that is not visible to the human eye.
This article outlines how multispectral UAV mapping supports early-season decision-making in UK spring crops. The key objectives are:
- Crop Assessment: Identifying variability in emergence and early vigour across the field.
- Early issue detection: Highlighting stress before it becomes visible.
- Targeted intervention: Enabling precise, evidence-based agronomic decisions.
Multispectral Data and Vegetation Indices
Conventional cameras capture light in the visible spectrum—red, green, and blue wavelengths. While suitable for visual inspection, this provides limited insight into plant condition.
A multispectral sensor captures additional wavelengths beyond visible light, including red edge and near-infrared (NIR) bands. These wavelengths are closely linked to plant physiology and provide measurable indicators of crop health.
Platforms such as the DJI Mavic 3 Multispectral capture reflectance across multiple spectral bands, allowing detailed analysis of vegetation response. Healthy, chlorophyll-rich plants absorb red light for photosynthesis and reflect near-infrared light due to internal leaf structure. When crops are stressed or poorly established, this reflectance pattern changes.
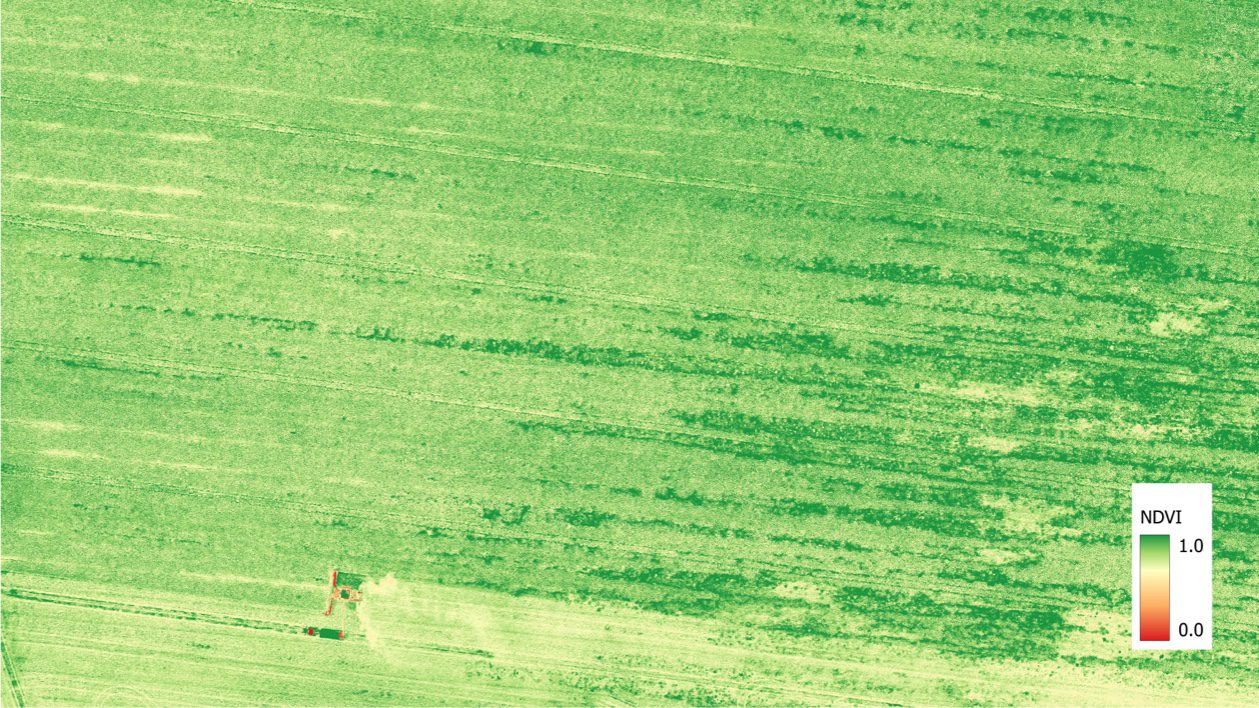
NDVI mapping highlights spatial variation in crop establishment and early vigour across the field.
From these measurements, vegetation indices can be derived to quantify crop condition across the field.
- The most widely used index is NDVI (Normalised Difference Vegetation Index), which compares red and near-infrared reflectance to assess overall plant vigour and canopy development.
- Alongside NDVI, NDRE (Normalised Difference Red Edge) uses the red edge band to detect more subtle variations in chlorophyll content, making it particularly useful for identifying early nutrient stress.
Combining these indices enables calculation of CCCI (Canopy Chlorophyll Content Index), which provides an indication of nitrogen status within the crop and supports fertiliser planning.
Lower NDVI values indicate areas of reduced growth, often linked to soil conditions or establishment issues.
Together, these outputs provide a spatially consistent, quantitative view of crop performance, offering a level of detail that cannot be achieved through visual inspection alone.
Early Growth Stages and Field Variability
Spring cereals in the UK are typically drilled between late February and mid-April, with most spring barley established during March. Within two to three weeks, crops reach early growth stages defined as GS11 to GS13 on the Zadoks scale, representing one to three leaves emerging.
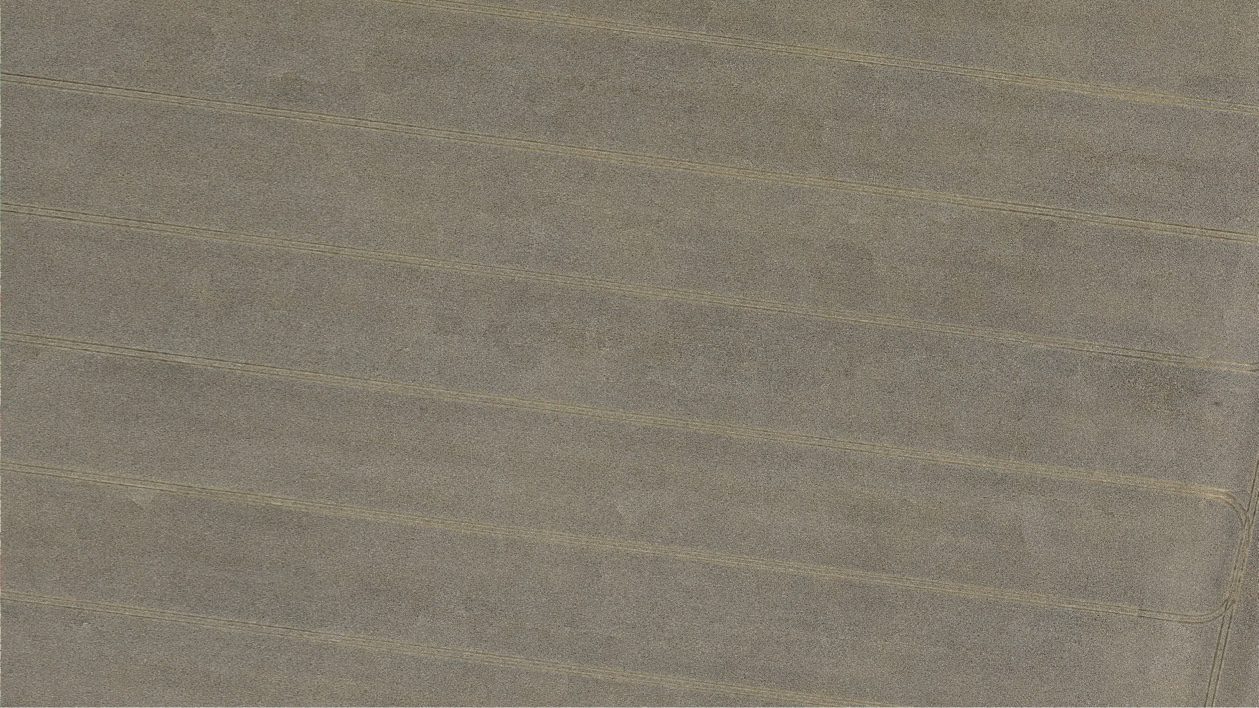
At this stage, fields often appear uniform when viewed from ground level. However, this visual consistency can mask significant variability in establishment.
Differences in soil structure, moisture retention, and organic matter can result in uneven germination across a field. Localised issues such as waterlogging, compaction, or pest pressure further contribute to variation in plant development.
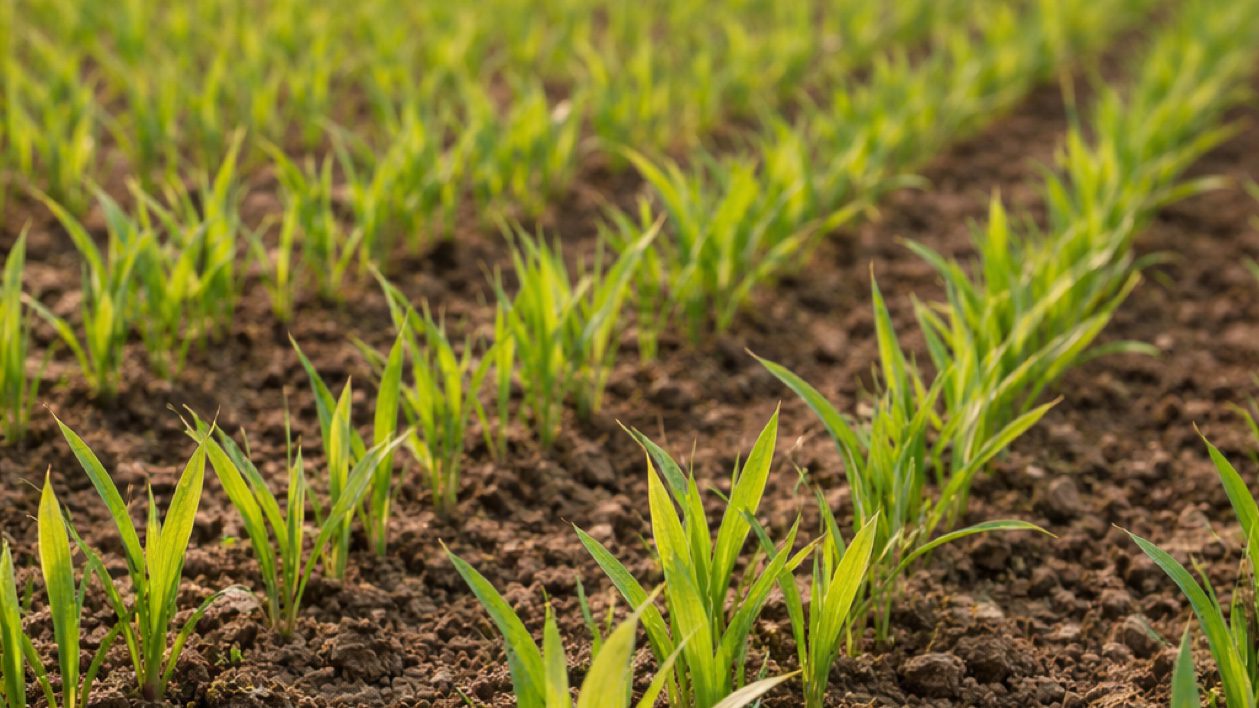
Early growth stage (GS11–GS13) where variability in crop establishment first becomes measurable.
These differences are not always immediately visible. However, they are detectable in spectral reflectance data.
A healthy plant reflects near-infrared light strongly and absorbs red light efficiently. Where growth is suppressed, this balance shifts. Reduced chlorophyll content leads to increased red reflectance and lower near-infrared reflectance.
The red edge band is particularly sensitive to early changes in chlorophyll levels, allowing stress to be identified before it becomes visible in the canopy.
As a result, two areas of a field that appear similar at GS13 may show clear differences in multispectral data. These early variations often persist throughout the growing season and influence yield outcomes.
UAV Mapping and Field-Scale Analysis
UAV multispectral surveys provide an efficient method for capturing this variability across entire fields.
A typical arable site can be surveyed within a single flight, often in under an hour, with no disruption to field operations. Data is processed into georeferenced maps, typically delivered within 24 to 48 hours.
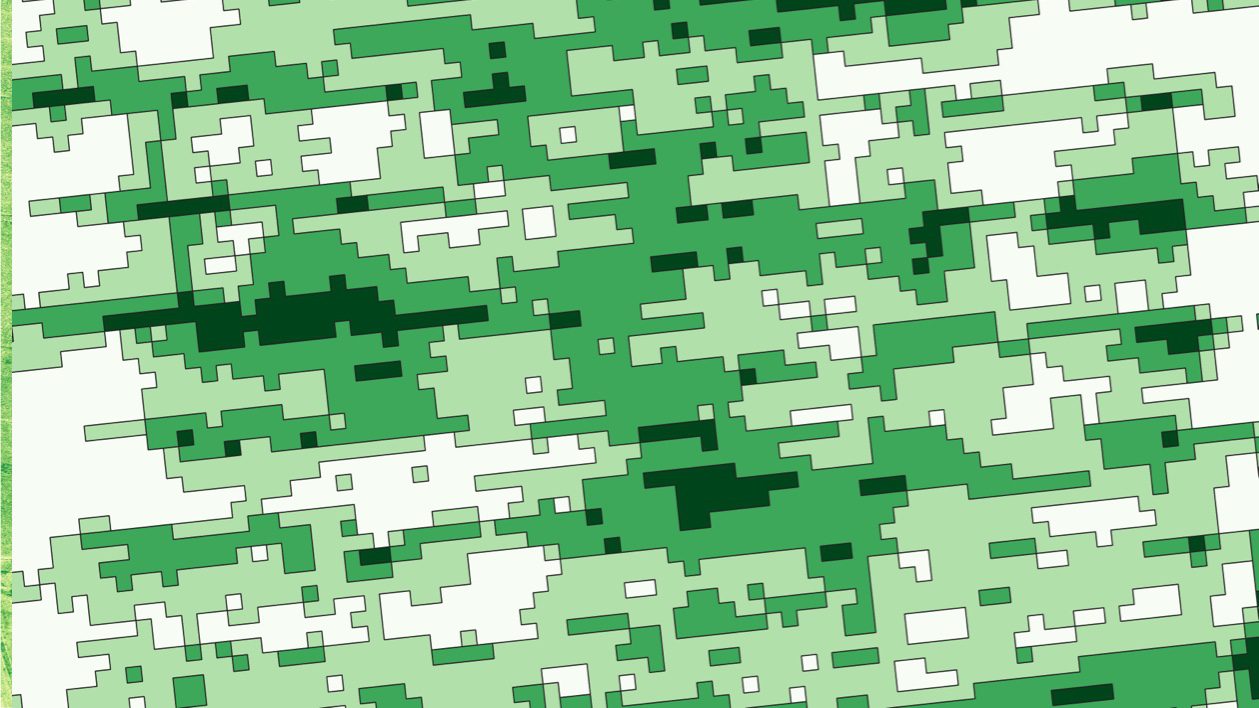
H3 spatial indexing used to segment the field into consistent analytical units for data comparison.
These outputs are presented as vegetation index maps, where each pixel corresponds to a measured value of crop performance. Areas of strong establishment are clearly distinguishable from zones where growth is reduced.
The spatial distribution of these variations is often as informative as the values themselves. Patterns within the data can indicate underlying causes:
- Linear variation aligned with drilling direction may indicate seeding inconsistency
- Depressed zones following natural drainage lines may suggest waterlogging
- Localised clusters at field margins may indicate pest activity
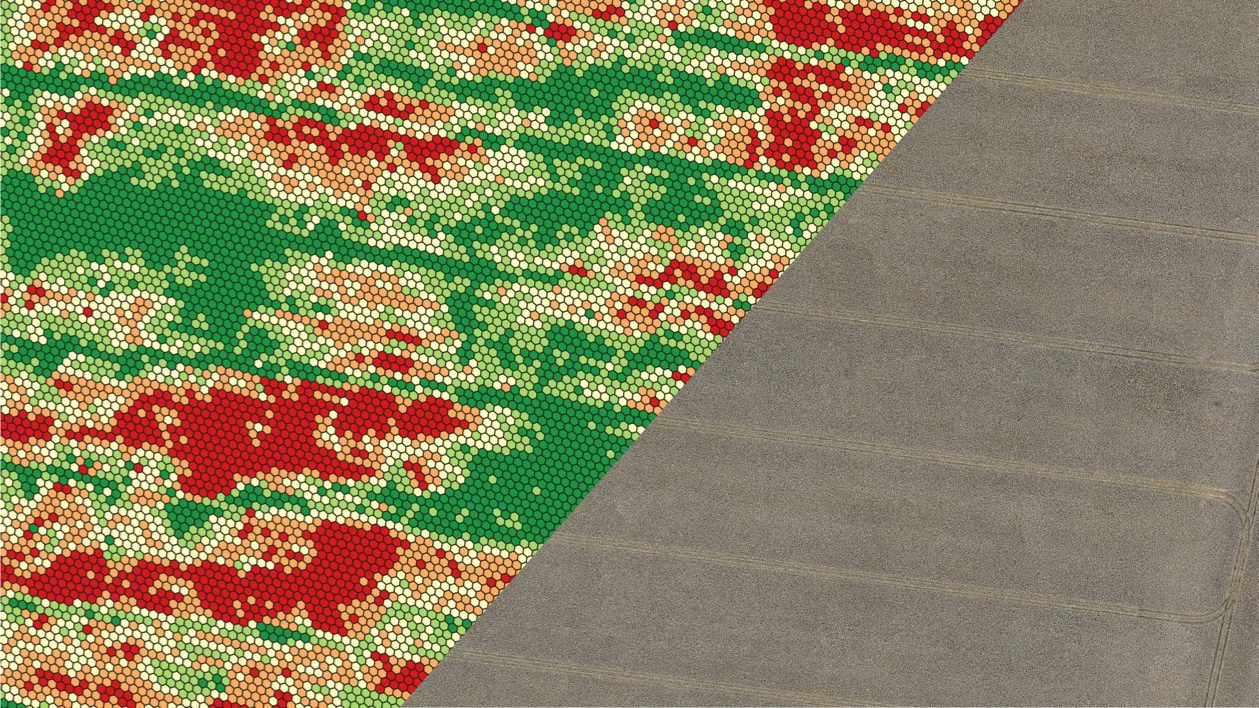
Averaged NDVI values across H3 tiles provide a structured view of crop variability and spatial trends. Processed spatial data supports targeted agronomic decision-making across variable field conditions.
This enables targeted ground inspection, reducing the need for time-intensive field walking and ensuring that attention is focused on areas of concern.
In practical terms, drone survey data supports evidence-based decision-making, allowing agronomists and farm managers to respond to issues at a stage when intervention remains effective.
Conclusion
Spring cereal crops operate within a compressed growing window, where early-stage performance has a disproportionate impact on final yield. Variability in establishment is common, but it is rarely fully understood through visual inspection alone.
Multispectral UAV surveys provide a means of bridging this gap. By capturing reflectance data across multiple wavelengths, they deliver a consistent, field-scale assessment of crop condition during the critical early growth stages.
This does not alter the biological constraints of the crop. However, it significantly improves the ability to detect and respond to issues while corrective action is still possible.
On a recent UK spring barley site, early-season NDVI mapping identified a measurable reduction in crop vigour across low-lying areas of the field. While these zones appeared visually consistent from ground level, multispectral data indicated suppressed establishment linked to soil moisture retention. Targeted field inspection confirmed localised waterlogging, allowing early-stage management decisions to be adjusted accordingly.
For agronomists and farm managers, this approach enables earlier insight, improved decision-making, and more efficient field management.
If you are considering multispectral drone surveys for crop monitoring, contact the Survey Air team to discuss your requirements: https://surveyair.co.uk/contact